Here you can find information about SPOT (Student Perceptions of Teaching) reports, which offer valuable feedback from students to support teaching effectiveness and program improvement. Faculty, chairs, and deans can use these reports to reflect on instructional practices, identify areas for growth, and recognize strengths. Reports become available after final grades are submitted to ensure confidentiality and maintain the integrity of the evaluation process.
Getting Logged in
You can access the Watermark system directly using this link: Watermark Course Evaluations & Surveys. Simply log in with your TCU Username and Password to enter the system to begin viewing or generating reports.
Accessing Reports
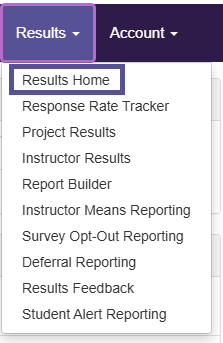
To access reports, go to the Results Home Page by selecting the Results tab and then Results Home from the navigation bar. Results Home offers an easy-to-use, interactive, and insightful reporting experience. Faculty with access to reports now have a centralized location to view and manage their reporting needs. This feature is available by default for all users with report access.
This page displays a Project Spotlight, which you can filter to quickly view information about the projects you have access to. To create more detailed or customized reports, click the Build a Report button in the top-right corner of the page.
Types of Reports
Here you can view the different types of reports available, along with descriptions of their purpose. The information below highlights the most commonly used report types.
Response Rate Tracker
The response rates for all courses available to a specific user, organized by project. It displays the overall response rate and provides access to Respondent and Non-Respondent files, which indicate which students have completed a survey. To protect confidentiality, these files do not link student names to their individual survey responses.
The response rate represents the percentage of submitted surveys compared to total course enrollments. For example, if a course has 32 enrolled students and 29 surveys are submitted, the response rate is calculated as 29 ÷ 32 = 0.90625, or approximately 91% after rounding.
Project Results
The response information for a selected project, including data for its departments, instructors, and individual course sections. After selecting a project, it can be searched by hierarchy level (such as college or department), course section, or instructor name to generate a report. The results allow you to view response rates, participation numbers, and aggregated or individual course section data, giving insight into survey engagement across different levels.
Instructor Results
This feature allows administrators and instructors to view course results across multiple projects and generate batch reports. Results can be sorted by course code, title, unique ID, hierarchy level, or project for easier navigation.
This is especially helpful for instructors who want to review their course evaluations over time or across several projects.
Report Builder
Create a custom report by selecting the data and filters you want to include. Administrators and instructors can build reports that combine information from multiple projects, filtered by hierarchy level, instructor, course, and/or question criteria.
Once created, reports are saved to the user’s account and can be copied, edited, or shared with others for future use.
Instructor Means Reporting
This feature is available only to administrators. It provides aggregated mean scores for selected questions, either for a specific course or for an instructor across multiple courses.
Instructor Means Reporting data becomes available only after the project or course-level survey access end date has passed, ensuring all responses are collected before results are calculated.
Report Options
When downloading reports, you can choose from several options depending on how much detail you need. This allows you to tailor the report to your specific needs, whether you want a quick overview or a more in-depth look at the data.
Detailed Report – a quantitative report without write-in comments in PDF format.
Detailed Report + Comments – A quantitative report including write-in comments in PDF format.
Short Report – A condensed, quantitative report without write-in questions in PDF format.
Short Report + Comments – A condensed, quantitative report including write-in comments in PDF format.
Raw Data – Provides detailed evaluation data in a spreadsheet format.